Using Aerial Photos to Increase Vineyard Profits
Trouble locating suitable land for your vines? Not sure if your vineyard will get the maximum amount of sunlight, right soils, or adequate air circulation? Worried about harvesting your blocks at the optimal time and managing disease? These questions challenge both hobby and commercial grape producers. To help take the guess-work out of vineyard planning and management, more vineyards are turning to affordable Geographic Information Systems (GIS) technology to improve their grape quality and yield, help with disease and pest management, and reduce the risk inherent in grape production.
Using readily available, free GIS data from local agriculture extensions, state and federal agencies, GIS analysis can help determine whether your land is suitable for vineyard production, the best layout for your rows, and where you can find more land to expand.
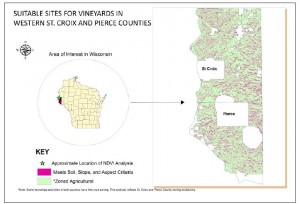
The Suitable Sites for Vineyards map below illustrates how GIS analysis can be used for locating vineyard sites with a higher potential for success. The ‘overlay” analysis of geographic soils, elevation, and zoning data in the western halves of St. Croix and Pierce Counties, Wisconsin, identified areas that are suitable for grape production. The geographic data were reclassified, layered and then combined to extract only desirable criteria — areas containing well-drained soils, slopes between 2 and 12 percent, south, southwest and southeast aspects, and zoned ag-residential or agricultural in each County. The suitable areas are shown in magenta.
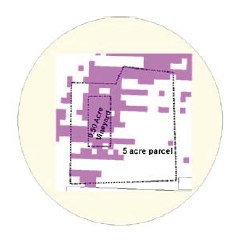
The Suitable Sites for Vineyards map can be scaled to any vineyard size as illustrated in the 5-acre parcel map on the left. The areas in purple meet the suitable site criteria. The higher the resolution of the geographic imagery used, the more accurate the analysis results will be.
Another useful GIS tool is imagery analysis. This type of precision analysis was initially used by Midwest farmers to manage corn, soybean, sugar beets and other traditional crops. Today, many vineyard owners are turning to imagery analysis using 4-band color infrared (CIR) air photos and GIS analysis to measure and monitor vineyard health.
Here’s how it works: Plants absorb and reflect different wavelengths of light. Healthy plants that are photosynthesizing, including vine canopies, reflect significant amounts of near infrared light (which is not visible to the human eye). Cameras with special lenses, multispectral imaging instruments and filters capture wavelengths both visible and invisible to the human eye.
Color infrared (CIR) imagery can help detect plant disease before it becomes visible to the human eye enabling immediate action before the disease spreads. The Normalized Differential Vegetation Index (NDVI) is an imagery analysis tool used to measure plant vigor/biomass. Using NDVI data to calculate a vineyard’s strengths and weaknesses– evidence of disease, over- or under-watering or fertilizing, for example–is becoming more widely used in vineyard management. NDVI images are derived from a mathematical normalization technique that processes only the red and near-infrared energy measurements.
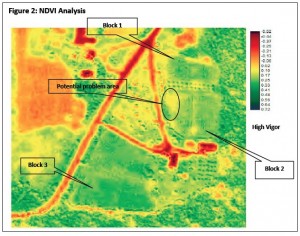
Computer software programs like IDRISI and Esri ArcMap can quickly calculate NDVI values. The NDVI image below illustrates a measurement of NDVI calculated for a vineyard located in northwest St. Croix County (see Suitable Sites for Vineyards above). IDRISI software and red and infrared bands of 1-meter resolution imagery from the Farm Service Agency captured in late July 2008 were used to calculate NDVI. A 1-meter image means each pixel represents a 1 meter by 1 meter square on the ground.
The higher vigor/biomass canopy directly correlates to the higher NDVI values. The lower values represent roads and non-vegetated areas or plants with lower biomass. The vines located in the NW area of Block 2 have relatively low NDVI values and may indicate a problem. Pinpointing trouble areas like this saves time and money by identifying disease, irrigation and fertilizer requirements. The higher the image resolution the more accurate the NDVI results are. Programs like GreenSeeker are being used in California to collect extremely accurate NDVI readings. GreenSeeker optically scans the vineyard canopy from just a few feet above the row and calculates NDVI conditions instantaneously. For more information about GreenSeeker visit http://www.ntechindustries.com/
Air photos from state and local sources in Minnesota and Wisconsin are free. To download Minnesota air photos go to http://www.mngeo.state.mn.us/chouse/airphoto/fsa.html. Visit the Wisconsin State Cartographer’s Office at http://www.sco.wisc.edu/find-maps/air-photos.html for instructions on downloading Wisconsin air photos.
Producing cold climate grapes in the Midwest presents many challenges. The costs associated with vineyard establishment can take years to recover. Using GIS technology to help reduce risk and make better vineyard management decisions will increase your bottom line. There are numerous self- education GIS websites and tools online. Visit Esri’s ArcGIS site for an affordable software program ($100 per year) at http://www.esri.com/
This story was reprinted with permission of the Minnesota Grape Growers Association (MGGA) and first appeared in MGGA’s “Notes from the North.” Midwest Wine Press is proud to be a member of the MGGA. Please visit their website at mngrapegrowers.com
[wp_geo_map]


